Click on the chart to access donor pages
The following donors contribute less than 2%:
| Donor | % |
|---|---|
| Ireland | 1.74 |
| United Arab Emirates | 1.66 |
| Belgium | 1.35 |
| Switzerland | 1.35 |
| Italy | 0.81 |
| Japan | 0.58 |
| Finland | 0.41 |
| LEGO Foundation | 0.29 |
| Russia | 0.16 |
| Republic of Korea | 0.14 |
| Luxembourg | 0.11 |
| Children's Investment Fund Foundation (CIFF) | 0.08 |
| Open Society Foundations | 0.03 |
| Stichtung Benevolentia (Porticus) | 0.02 |
| Dubai Cares | 0.02 |
| Senegal | 0.01 |
| Estonia | 0.01 |
| Romania | 0.01 |
| Rockefeller Foundation | 0.004 |
| Harry Hole Foundation | 0.003 |
Note:
- The percentages in this graph show donor contributions signed into agreement and received. Pledges not yet signed into an agreement are not included.
Grant data
View the full GPE grant portfolio, with comprehensive data on allocations and utilization from 2003 to today. The data can be filtered by grant type, region, country, income level, grant agent and fragility status, and downloaded to Excel.
Donor ranking 2021-2025
Breakdown of donor contributions for the 2021-2025 financing period
| Donor | % | Rank |
|---|---|---|
| European Commission | 20.74% | 1 |
| United Kingdom | 14.82% | 2 |
| France | 9.87% | 3 |
| Germany | 9.76% | 4 |
| United States | 8.64% | 5 |
| Canada | 6.02% | 6 |
| Norway | 5.37% | 7 |
| Denmark | 3.93% | 8 |
| Sweden | 3.50% | 9 |
| Australia | 3.38% | 10 |
| United Arab Emirates | 2.47% | 11 |
| Ireland | 1.78% | 12 |
| Netherlands | 1.46% | 13 |
| Switzerland | 1.41% | 14 |
| Saudi Arabia | 0.94% | 15 |
| Belgium | 0.83% | 16 |
| Finland | 0.74% | 17 |
| Italy | 0.74% | 18 |
| Kuwait | 0.74% | 19 |
| Lego Foundation | 0.69% | 20 |
| Spain | 0.59% | 21 |
| Japan | 0.50% | 22 |
| Qatar (through EAA) | 0.49% | 23 |
| Republic of Korea | 0.39% | 24 |
| Luxembourg | 0.07% | 25 |
| Dubai Cares | 0.06% | 26 |
| Estonia | 0.02% | 27 |
| Open Society Foundation | 0.02% | 28 |
Implementation grant allocations and utilization
Notes:
- This chart includes data from 2002 to present. Grant portfolio and approval data is updated at least monthly; grant utilization data follows the grant agents’ reporting schedules: it can be monthly, quarterly or bi-annually.
- During FY20, the GPE Secretariat implemented a different reporting methodology to further track monthly disbursements made from the GPE Trust Fund and quarterly utilization by programs. Disbursements thus refer to financial transfers made from the GPE Trust Fund to grant agents, while quarterly utilization refers to transfers to and actual expenditure by programs.
- The World Bank income categorization from the year prior to grant approval is applied to each grant. Note however that the income category is not applicable to global grants.
- Grant allocation for closed grants includes refunds and cancellations even if the refund occurred in a subsequent year.
- The categorization ‘partner country affected by fragility and conflict’ looks at the grant approval year and pulls the data (which is created by merging the World Bank fragility list with the UNESCO conflict-affected list) for the previous year (the exceptions are grants approved in 2016 and earlier, which all use 2016 data).
- The term "implementation grant" refers to: regular education sector program implementation grant (ESPIG), combined ESPIG and Multiplier grants, Multiplier, regular accelerated funding, and additional financing.
Grants by region
Notes:
- This chart includes data from 2002 to present. Grant portfolio and approval data is updated at least monthly; grant utilization data follows the grant agents’ reporting schedules: it can be monthly, quarterly or bi-annually.
- The term "implementation grant" refers to: regular education sector program implementation grant (ESPIG), combined ESPIG and Multiplier grants, Multiplier, regular accelerated funding, and additional financing. In addition, ESPDG refers to education sector plan development grant; SCG to system capacity grant; and PDG to program development grant.
- Global COVID-19 accelerated implementation grants are included in this chart.
- When clicking a region and seeing the related data, the column "Number of grants for partner countries affected by fragility and conflict” refers to the number of approvals in each region (not to the number of partner countries) that are affected by fragility or conflict.
- The categorization ‘partner country affected by fragility and conflict’ looks at the grant approval year and pulls the data (which is created by merging the World Bank fragility list with the UNESCO conflict-affected list) for the previous year (the exceptions are grants approved in 2016 and earlier, which all use 2016 data).
- Each approved grant is counted separately (including when the grant is accelerated funding). The exception is that additional financing is excluded from grant counts. In addition, if a grant has two grant agents, it is counted as one grant except when looking at grant count by grant agent.
- "Closed grants" refers to all the grants that have closed since inception.
- Grant allocation for closed grants includes refunds and cancellations even if the refund occurred in a subsequent year.
Grants by grant agent
Notes:
- This chart includes data from 2002 to present. Grant portfolio and approval data is updated at least monthly; grant utilization data follows the grant agents’ reporting schedules: it can be monthly, quarterly or bi-annually.
- The term "implementation grant" refers to: regular education sector program implementation grant (ESPIG), combined ESPIG and Multiplier grants, Multiplier, regular accelerated funding, and additional financing. In addition, ESPDG refers to the Education Sector Plan Development Grant; SCG to the System Capacity Grant; and PDG to the Program Development Grant.
- Global COVID-19 accelerated implementation grants are included in this chart.
- When clicking on a grant agent and seeing the related data, the column "Number of grants partner countries affected by fragility and conflict” refers to the number of approvals for each grant agents (not to the number of partner countries) that are affected by fragility or conflict.
- The categorization ‘partner country affected by fragility and conflict’ looks at the grant approval year and pulls the data (which is created by merging the World Bank fragility list with the UNESCO conflict-affected list) for the previous year (the exceptions are grants approved in 2016 and earlier, which all use 2016 data).
- Each approved grant is counted separately (including when the grant is accelerated funding). The exception is that additional financing is excluded from grant counts. In addition, if a grant has two grant agents, it is counted as one grant except when looking at grant count by grant agent.
- Grant allocation for closed grants includes refunds and cancellations even if the refund occurred in a subsequent year.
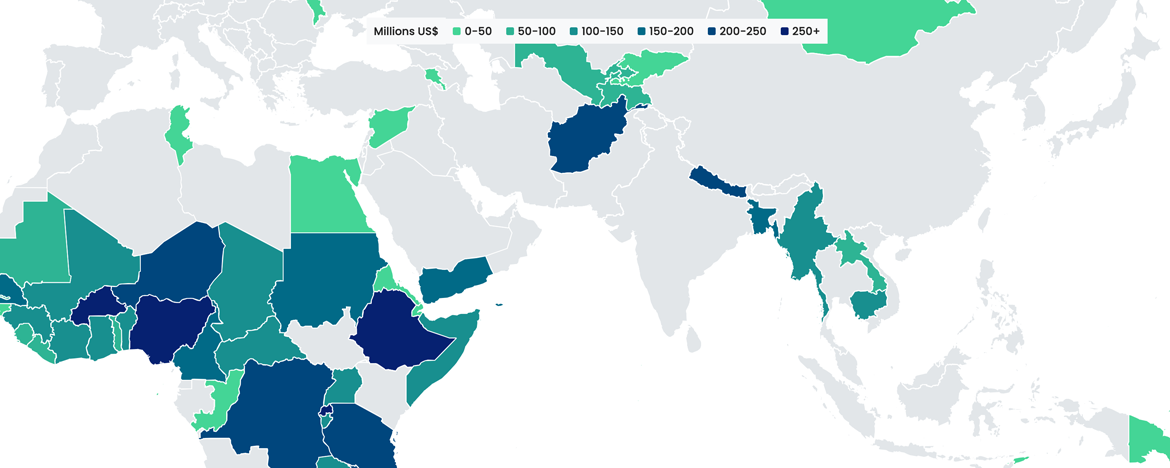
Grants by country
Notes:
- This chart includes data from 2002 to present. Grant portfolio and approval data is updated at least monthly; grant utilization data follows the grant agents’ reporting schedules: it can be monthly, quarterly or bi-annually.
- The term "implementation grant" refers to: regular education sector program implementation grant (ESPIG), combined ESPIG and Multiplier grants, Multiplier, regular accelerated funding, and additional financing.
- Grant allocation for closed grants includes refunds and cancellations even if the refund occurred in a subsequent year.
- During FY20, the GPE Secretariat implemented a different reporting methodology to further track monthly disbursements made from the GPE Trust Fund and quarterly utilization by programs. Disbursements thus refers to financial transfers made from the GPE Trust Fund to grant agents, while quarterly utilization refers to transfers to and actual expenditure by programs.
- Four countries (Dominica, Grenada, St Lucia, and St Vincent and the Grenadines) access their allocations through a single regional application submitted by the Organization of the Eastern Caribbean States (OECS).
Portfolio overview
| Grant type | Number of grants since 2002 | Amount allocated since 2002 (US$ million) | Amount utilized since 2002 (US$ million) |
|---|
Notes:
- This table includes data from 2002 to present. Grant portfolio and approval data is updated at least monthly; grant utilization data follows the grant agents’ reporting schedules: it can be monthly, quarterly or bi-annually.
- The term "implementation grant" refers to: regular education sector program implementation grant (ESPIG), combined ESPIG and Multiplier grants, Multiplier, regular accelerated funding, and additional financing. In addition, ESPDG refers to the Education Sector Plan Development Grant; SCG to the System Capacity Grant; and PDG to the Program Development Grant.
- Global COVID-19 accelerated implementation grants are included in this table.
- Each approved grant is counted separately (including when the grant is accelerated funding). The exception is that additional financing is excluded from grant counts. In addition, if a grant has two grant agents, it is counted as one grant except when looking at grant count by grant agent.
- Grant allocation for closed grants includes refunds and cancellations even if the refund occurred in a subsequent year.
Transparency in financial reporting
GPE adheres to the highest standards of transparency with regards to its governance, policies, financing and program funding.
GPE reports its grant allocations and disbursements, disaggregated by level of education, to the Organization for Economic Cooperation and Development (OECD). The OECD is using GPE data to pilot a new initiative called Total Official Support for Sustainable Development (TOSSD).
Financial reports
GPE publishes annual financial reports as mandated by the rules of the GPE fund. Some reporting are prepared by the World Bank, as Trustee of the GPE Trust Fund.